Your Microsoft Technology Development and Consulting Experts - Operating since 2000

Australia WideSydney, NSWMelbourne, VicBrisbane, QldPerth, WAAdelaide, SACanberra, ACTNorthern Rivers, NSWWollongong, NSWRichmond, VicDarwin, NT
Your Microsoft Technology Development and Consulting Experts - Operating since 2000


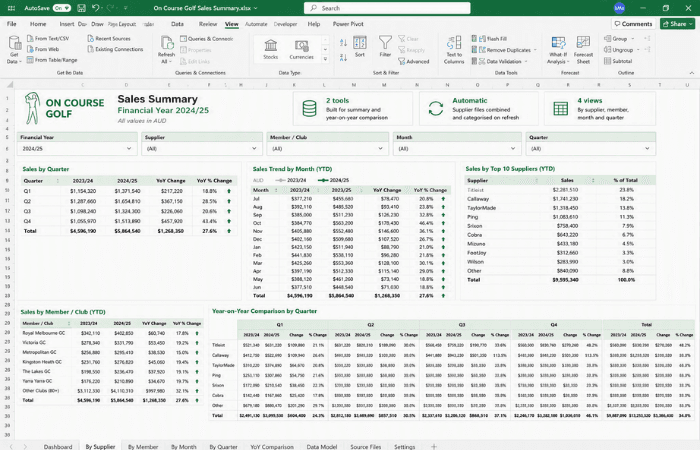
The client received dozens of separate Excel files from each supplier throughout the year, detailing sales made to every club and member across each month and quarter. We built a Power Query and Power Pivot solution that pulls all of this raw data in automatically, categorises it, and produces year-on-year comparisons by supplier, member, month and quarter without a single manual copy and paste.
The challenge
The client received a steady stream of Excel files from each of its suppliers throughout the year, with every file detailing the sales that supplier had made to each golf club or member over the course of a quarter. Across all suppliers and all quarters, this added up to a large number of separate files landing throughout the year.
None of these files were in a consistent, ready-to-analyse format on their own. To understand how the business was actually performing, someone needed to bring every supplier's figures together and summarise them across the entire financial year, comparing sales by supplier, by club or member, and by month and quarter.
On top of the annual summary, The client also needed to compare results from one financial year to the next. That meant taking the same quarterly breakdowns, by supplier, by member, or both, and showing the movement between the same quarter in consecutive years, not just the raw totals.
Doing this by hand meant manually opening, checking and combining a large number of supplier files every year, then repeating a similar manual effort again just to compare two years' worth of already-summarised results.
Our approach
We built an Excel workbook using Power Query to automatically bring in all of the raw supplier sales files for a financial year, rather than requiring each one to be opened and copied in by hand. As new files were added, the workbook picked them up on refresh.
Once the raw files were pulled in, we used Power Query to clean and categorise the combined data consistently, so every supplier's figures lined up the same way regardless of how the original file had been laid out.
We used Power Pivot to build the summarised results the client needed, allowing sales to be compared and viewed by supplier, by club or member, and across every month and quarter of the financial year, all from the one workbook.
We built a second Excel workbook that automatically extracts the results from two consecutive financial year summary files, rather than requiring the figures to be re-entered or copied across manually.
This second workbook reproduces the same summary breakdowns as the original files, by supplier, by member, or both, while also calculating and displaying the difference for each quarter compared to the same quarter the previous financial year.
The outcome
The clent can now bring in every supplier's raw sales files and get a fully categorised, summarised view of the financial year without manually combining a single file by hand.
Sales can be compared by supplier, by club or member, and across every month and quarter, giving a clear picture of performance that would previously have taken considerable manual effort to piece together.
Comparing one financial year against the next is now handled automatically as well, with quarter-on-quarter movement calculated directly from the two summary files rather than reworked from scratch each time a year-on-year comparison was needed.
Copyright © 2024. Brayalei Pty Ltd T/As Office Experts Group. ABN 32 093 067 737. ACN 093 067 737. All Rights Reserved.
 consult@officeexperts.com.au
 1300 102 810