 consult@officeexperts.com.au
 1300 102 810
Millions of rows, high performance
The Data Model compresses your data in memory, so reports stay quick on volumes that would stall an ordinary worksheet.
Your Microsoft Technology Development and Consulting Experts - Operating since 2000



We build the data models, DAX calculations and reports behind fast, reliable reporting in Excel and Power BI, so your team spends less time wrangling spreadsheets and more time acting on the numbers.
At Office Experts Group, our Power Pivot consultants help businesses turn raw data into strategic insight. By creating robust data models, building powerful calculations and enabling self-service analytics, we ensure your team has the tools they need to make informed decisions, fast.
With decades of experience across Excel, Power BI and the Microsoft data stack, we bring clarity and structure to even the most complex data environments.
Power Pivot is Microsoft's in-memory data modelling engine. It is built into Excel as the Data Model, and the same technology powers Power BI.
The Data Model compresses your data in memory, so reports stay quick on volumes that would stall an ordinary worksheet.
Link sales, customers, products and dates once, then analyse them together without chains of lookup formulas.
Data Analysis Expressions (DAX) handle year-to-date totals, margins and ratios, written once and reused in every report.
Pivot tables, charts and slicers all read from the same model, so they refresh together and always agree.
Whether you're working with finance, operations, sales or any other department, Power Pivot transforms how your team interacts with data, turning spreadsheets into smart, scalable reporting systems.
Standard pivot tables work well on a single clean table. These are the signs your reporting has outgrown them.
The workbook freezes, or runs into the 1,048,576-row limit
The Data Model holds far more data and stays responsive
VLOOKUP and INDEX/MATCH columns stitch the tables together
Relationships join the tables with no helper columns
Every report carries its own copy of the formulas
Each measure is defined once and shared by every pivot table
Month end means copying, pasting and double-checking
Refresh the model and every report updates
Only one person really understands the workbook
A structured model the whole team can slice and explore
A DAX measure is a reusable calculation that responds to whatever a person is looking at. Filter by state, product or month and the same measure recalculates, with no new formulas to write or check.
These three come from a typical sales model. They work in any pivot table or chart, in Excel or Power BI, and they are the building blocks of far more complex KPIs.
Total Sales =
  SUM(Sales[Amount])
The base measure. Every other calculation builds on it.
Sales YTD =
  TOTALYTD([Total Sales], 'Calendar'[Date])
Year to date, restarting each year. Pass a year-end date to match the 30 June financial year.
Sales vs Last Year =
  [Total Sales] -
  CALCULATE([Total Sales],
    SAMEPERIODLASTYEAR('Calendar'[Date]))
Compares each period with the same period last year, whatever the slicers are set to.
We specialise in Microsoft tools, so your Power Pivot setup will integrate seamlessly with Excel, Power BI, Power Query and Power Automate. Every project starts with a business analysis conversation, so the model answers the questions your team actually asks. From planning to deployment, we work closely with you to deliver practical, sustainable solutions.
We design clean, efficient data models that connect multiple data sources and eliminate redundancy. With properly structured relationships, your team can slice and analyse data in meaningful ways.
Our consultants write optimised DAX that captures your business rules, from simple metrics to complex KPIs. We make sure calculations are not only accurate, but fast and scalable.
Already using Power Query? We help you take the next step by feeding transformed data directly into Power Pivot models, giving you a seamless end-to-end data solution.
Slow reports and bloated workbooks are common with poorly built models. We apply proven best practices to improve performance, reduce file size and deliver responsive reporting.
From Excel pivot tables to Power BI dashboards, we design reports that are easy to explore, share and understand. No more manual updates or disconnected spreadsheets.
Power Pivot works best when combined with Power Query. Power Query handles the cleaning and shaping of your raw data, while Power Pivot enables powerful modelling and analysis.
Need the refresh and distribution to run on its own? Our VBA and automation developers can take care of that final step.
Power Query pulls in Excel files, CSVs, databases, SharePoint lists and web sources in one repeatable step.
Duplicates are removed, formats fixed and tables reshaped once, so the same steps run on every refresh.
Power Pivot links the tables with relationships and adds the DAX measures that hold your business rules.
Pivot tables, charts and Power BI dashboards read from the finished model and update with a single refresh.
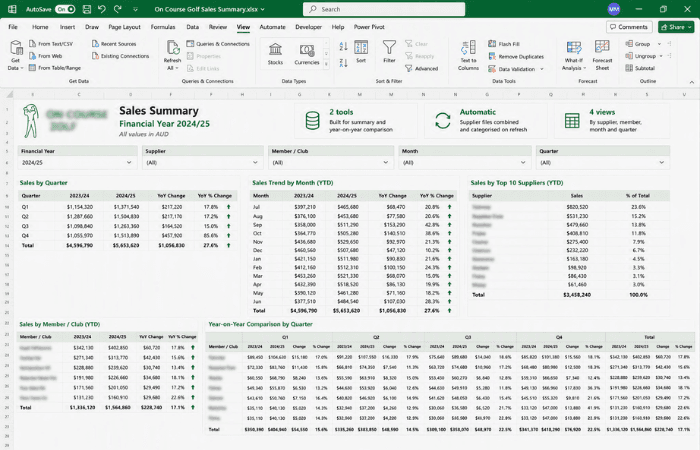
The client received dozens of separate Excel files from its suppliers each year, detailing sales to every club and member. Bringing them together by hand, then repeating the effort to compare one financial year with the next, took considerable time.
We built a Power Query and Power Pivot solution that pulls the raw files in automatically, categorises the data and produces summaries by supplier, member, month and quarter. A second workbook shows quarter-on-quarter movement between financial years, with no manual copy and paste.
PowerPivot extends Excel's capabilities by handling millions of rows of data, creating relationships between multiple tables from different sources, and enabling complex calculations through DAX formulas. It provides enterprise-level analytics while maintaining the familiar Excel interface.
No, it's not necessary. PowerPivot works effectively within Excel for advanced analytics, while Power BI offers more visualisation options and sharing capabilities. Many organisations use PowerPivot successfully without Power BI, though some eventually adopt both for complementary purposes.
Excel-proficient users typically require 1-2 days of training for basic PowerPivot usage. More advanced modelling and DAX formula development may require additional training. Our consulting engagements include customised training sessions tailored to your team's specific needs.
Yes, PowerPivot connects to virtually any business system or database including SQL Server, Oracle, Access, SAP, Salesforce, and many others. Our consultants specialise in creating reliable connections to even the most complex or legacy data sources.
PowerPivot is valuable for organisations of all sizes. Small businesses benefit from its ability to consolidate data from multiple sources and create professional reports without expensive BI tools. Large enterprises appreciate its ability to handle massive datasets and integrate with their existing Microsoft environment.
Copyright © 2024. Brayalei Pty Ltd T/As Office Experts Group. ABN 32 093 067 737. ACN 093 067 737. All Rights Reserved.